Fifth Finnish
Medical Physics and Medical Engineering Day
|
||||
|
In osteoporosis degenerative changes in bone composition and structure lead to diminished
bone strength and increased fracture risk. Ultrasound measurements have been introduced as
promising tools for osteoporosis diagnostics. However, soft tissues overlying bones may impair
reliability of these techniques. In this study the effect of overlying adipose and lean tissue
on bone ultrasound measurements was investigated at ultrasound frequencies of 0.2 - 6.7 MHz. In
addition, the effect of sound frequency on the ultrasound ability to predict mechanical properties
of trabecular bone was assessed. |
|
|||
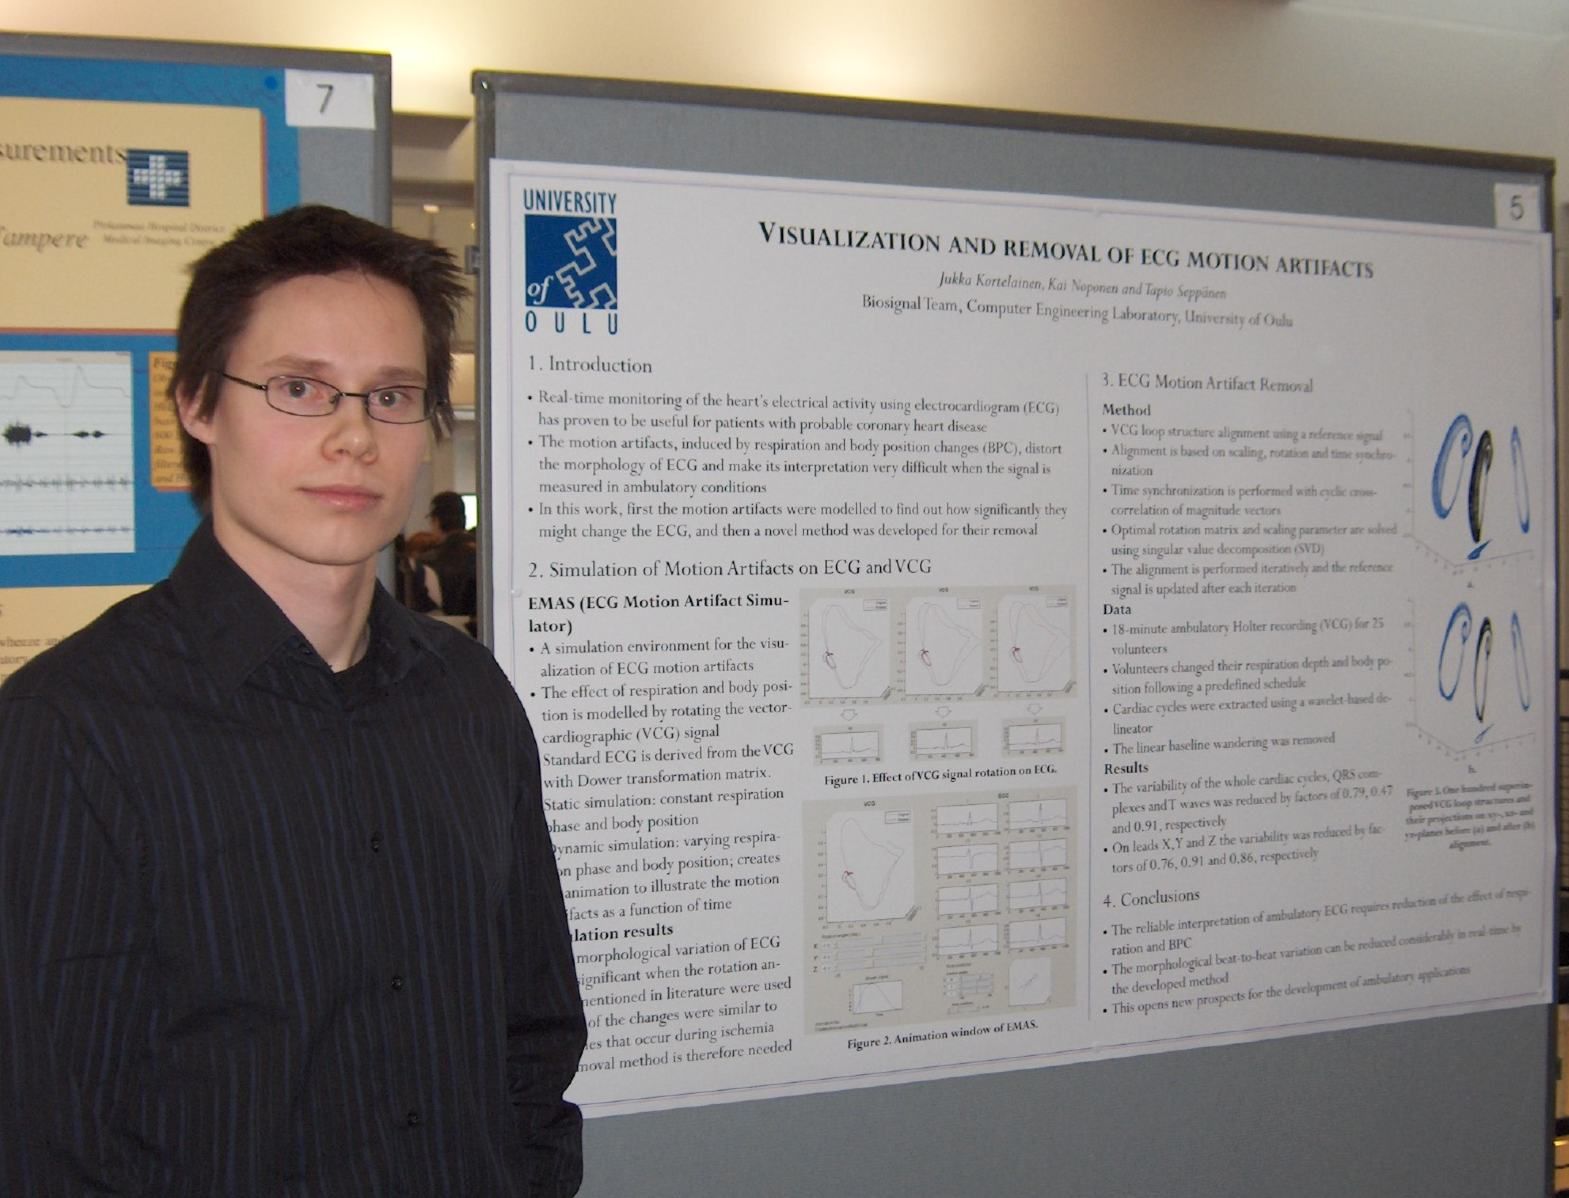
Jukka
Kortelainen, University of Oulu
|
||||
For the illustration of motion artifacts, a software simulation environment EMAS (ECG Motion Artifact Simulator) was created. With the designed software the user is able to simulate the effect of self-defined respiration and BPCs on vectorcardiogram (VCG) and ECG. The simulation is possible to carry out in a static manner, assuming that the respiration phase and body position are constant, or dynamic, in which the motion artifacts vary continuously as a function of time. The second objective of the study was the removal of motion artifacts. For this purpose, ambulatory VCG measurements were performed for 25 volunteers. During the recordings the volunteers were supposed to change their respiration depth and body position following a predefined schedule, and thus contaminating the signal with motion artifacts. A novel data alignment method for beat-to-beat variability reduction was then applied to the measurement data. The aim was to test the method and adjust its parameters to be optimal with the signals containing varying amounts of noise. For comparison, alignment was performed with two other methods presented in the literature. The new method was able to reduce the variability of whole the cardiac cycles, QRS complexes and T waves by factors of 0.79, 0.47 and 0.91, respectively, whereas the corresponding numbers for the other methods were 0.89, 0.64 and 0.96 at best. The results show that the morphological beat-to-beat variation of ambulatory ECG can be reduced considerably by the new method. Due to the method's low complexity, the variation reduction can be performed in real-time. This makes it possible to interpret continuously monitored ECG with a higher accuracy and hence decreases the amount of misclassifications. |
 |
|||
Petteri Lapinlampi,
Helsinki University of Technology
|
||||
We evaluated a novel measure, EEG/EMG responsiveness, and compared it to Ramsay scores. EEG/EMG responsiveness was calculated by applying an algorithm that detects abrupt changes in the measured EEG/EMG signal indicative of a patient's arousal or activation. The results were compared to those obtained using the EEG entropy. Thirty consenting general ICU patients with non-neurologic primary ICU diagnosis were investigated for a maximum of 72 hours. The Response Entropy (RE) and State Entropy (SE) values as well as the EEG signal from which the EEG/EMG responsiveness was calculated were recorded from forehead electrodes using the Entropy™ Module (GE Healthcare). When possible, Ramsay score was evaluated every 30 minutes by a single trained observer, amounting to a total of 370 assessments. The obtained prediction probability PK = 0.86 for EEG/EMG responsiveness to distinguish deep Ramsay levels 4-6 from levels 1-3 was significantly higher than the corresponding PK values 0.80 and 0.79 for RE and SE, respectively (p<0.05). In the subgroup of 18 patients judged clinically to have no acute brain disorders, the PK values for EEG/EMG responsiveness, RE, and SE (0.91, 0.85, and 0.84, respectively) were significantly higher (p<0.001) than those in the remaining subgroup of 12 patients with encephalopathy (0.78, 0.73, and 0.75). The novel measure of EEG/EMG responsiveness shows promise as an indicator for the level of sedation. As an objective and automatic method it provides valuable information for the nursing staff in order to titrate an optimal amount of sedative drugs to each patient. |
|
|||
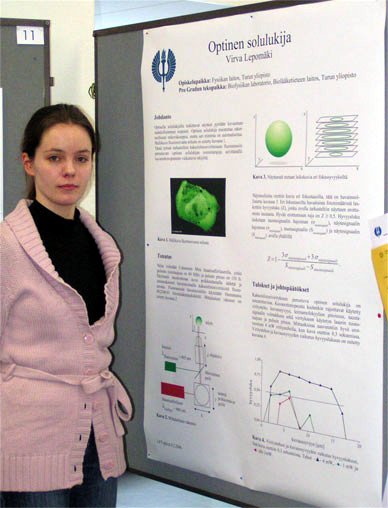
Virva
Lepomäki, University of Turku
|
||||
Parameters of two photon excitation based optical cell-reader are studied using theoretical analysis and measurements. In this work we use imaging speed to determine limits for a two photon excitation based optical cell-reader. Special emphasis has been paid on the effects of focus depth end excitation power to imaging speed. From theoretical analysis and from measurements it can be seen that it is possible to measure samples very quickly. The imaging speed is restricted by the laser used to excite the label molecules, concentration of label molecules, background signal intensity and focus depth. |
 |
|||
Iina Tarnanen,
Helsinki University of Technology
|
||||
First, the influence of the components of a commercial EEG system (BrainAmp MR Plus, BrainProducts GmbH, Germany) on MR image quality, obtained with a 3-T MRI scanner (GE Signa 3.0 T with Excite) was examined. The components were placed on a standard gel phantom, and echo planar images (EPI) used in fMRI were obtained. The extent of the consequent susceptibility artefacts into the phantom was measured on a pixel-by-pixel basis from the images. Second, the effect of the static magnetic field on EEG quality was evaluated. Alpha activity, which is represented by 8-13 Hz oscillatory activity in the posterior parts of the brain, was recorded from one subject at 3 T in order to identify the extent of cardiac-cycle related artefacts enhanced by the static field. The frequency spectrum was determined using Hanning-windowed Fourier transform. The results showed that the largest image artefacts, which extended several centimetres into a phantom, were found to originate from electrode lead connectors. The size of the artefacts decreased with increased distance from the phantom. Other EEG system components perturbed the images to a lesser extent. EEG signal was heavily tainted by intense artefacts. However, alpha activity could be observed. In addition, unexpected interference was found in the EEG signal recorded within the MRI scanner bore. The frequency distribution of the interference was characterized by several large peaks of minimal variance centred around 24 Hz. In order to obtain good quality data, both the image and EEG artefacts need to be confined to minimum. Thus, the EEG lead connectors could be either detached from the skin or replaced by alternative non-magnetic connectors to reduce the image artefact to an acceptable level. The interference in the EEG was deduced to originate from the cryogenic pump of the MRI scanner. By turning off the pump during EEG recording and applying artefact removal methods, good quality EEG can be obtained. However, before simultaneous EEG and fMRI experiments can be commenced with human subjects, safety aspects need to be considered. |
|
|||